
1D Tritium first-order decay#
Overview and Capabilities tested#
This test example performs the simulation of decay of tritium, a radioactive isotope of hydrogen, in a 1D flow domain, testing the following capabilities:
1D flow
1D advective transport
geochemical reactions
First order decay (aqueous kinetics)
For details on this test, see About.
Background#
Tritium is a radioactive isotope of hydrogen that was added to the atmosphere during the nuclear bomb testing during the 1950’s and 1960’s at well above background concentrations. After the end of widespread nuclear bomb testing, tritium concentrations dropped. Concentrations of tritium in groundwater reflect when the water was in contact with the atmosphere, and they are used as an estimate of the rate of groundwater recharge. Tritium concentrations decay with time according to a first order expression. This first order decay is typically characterized by the half life ( \(t_{1/2}\) ).
Model#
Flow and transport#
See the 1D Conservative tracer transport example.
First order (kinetic) decay#
One single reaction is considered: tritium decay. This reaction is homogeneous and is modeled with a first order kinetic rate expression:
\(r = - \lambda c\)
where \(c\) is the concentration of tritium, and \(\lambda\) is the first order constant. This is related to the half life of tritium according to:
\(\lambda = \displaystyle\frac{ln(2)}{t_{1/2}}\)
Problem Specification#
Flow and transport#
See the 1D Conservative tracer transport example. In this example, tritium injected at constant concentration at the left boundary decays as it travels down gradient a 1D flow domain. The simulation is run to 50 years.
Geochemistry#
In this example, the half life of tririum is taken as \(t_{1/2} = 13.31 \text{ years}\). Thus, \(\lambda = 1.78577 \cdot 10^{-9} \text{ s}^{-1}\)
Results and Comparison#
Expected results#
Tritium enters the 1D column from the left and as it flows left to right it decays exponentially.
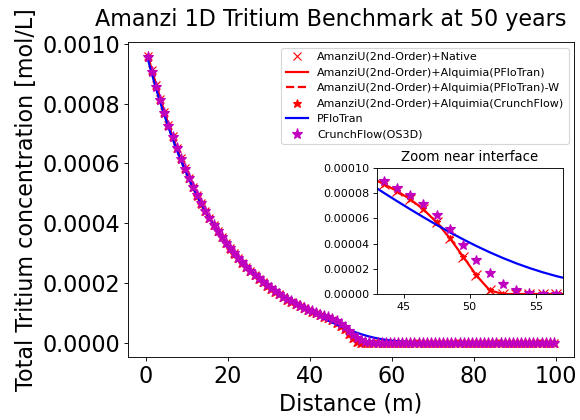
Simulation results#
In the figure below, the solution by Amanzi at time 50 years is compared to results obtained with PFloTran along the length of the colum. Agreement is very good overall. Minor differences in the leading edge are attributed to the numerical dispersion added by the different numerical schemes.
(Source code, png, hires.png, pdf)
About#
Benchmark simulator: PFlotran
Files
Amanzi input file/s (native chemistry): amanzi-1d-tritium.xml
Amanzi input file/s (Alquimia chemistry): amanzi-1d-tritium-alq.xml, 1d-tritium.in, tritium.dat
Benchmark simulator input file: 1d-tritium.in, tritium.dat, output file = pflotran/1d-tritium.h5
Location: amanzi/testing/benchmarking/chemistry/tritium_1d
Author: B. Andre, G. Hammond
Testing and Documentation: S. Molins
Last tested on Oct 3, 2013